Something came up in that work recently that I’ve found to be quite useful in my day to day coding sessions and that’s how to create a stack trace in ASP.NET AJAX.
For starters, JavaScript doesn’t provide an easy way of pulling the stack trace of the call so we’re going to have to roll our own.
I’ve seen a couple of different methods of creating the stack trace and the one I’m going to use comes from Helephant.com. I really like this implementation and I’m glad that I was able to poach somebody else’s code to create the stack trace (thx Helen!) rather than have to create mine from scratch.
From Helen’s post on Helephant.com we can see that there are three main functions to generate the stack trace: getFunctionName, getSignature, and stackTrace. Since we’re deep in the ASP.NET AJAX world I’ve updated the code to rely upon it and look more like code written for it. The code is below.
/// <reference name=”MicrosoftAjax.js />
/// Adopted from: http://www.helephant.com/Article.aspx?ID=675
_StackTrace = function() {
_StackTrace.initializeBase(this);
};
_StackTrace.prototype = {
_getFunctionName: function(theFunction) {
if(theFunction.name) {
return theFunction.name;
}
var definition = theFunction.toString();
var name = definition.substring(definition.indexOf(‘function’) + 8,definition.indexOf(‘(’));
if(name) {
return name;
}
return“anonymous”;
},
_getSignature: function(theFunction) {
var signature = newSys.StringBuilder(this._getFunctionName(theFunction));
signature.append(“(”);
for(var x=0; x < theFunction.arguments.length; x++) {
var nextArgument = theFunction.arguments[x];
if(nextArgument.length > 30) {
nextArgument = nextArgument.substring(0, 30) + “…”;
}
signature.append(String.format(“‘{0}’”, nextArgument));
// comma separator
if(x < theFunction.arguments.length – 1) {
signature.append(“, “);
}
}
signature.append(“)”);
return signature.toString();
},
createStackTrace: function(startingPoint) {
var stackTraceMessage = newSys.StringBuilder(“Stack trace: \n”);
var nextCaller = startingPoint;
while(nextCaller) {
stackTraceMessage.appendLine(this._getSignature(nextCaller));
nextCaller = nextCaller.caller;
}
stackTraceMessage.appendLine();
stackTraceMessage.appendLine();
return stackTraceMessage;
}
};
_StackTrace.registerClass(“_StackTrace”);
Sys.Application.add_init(
function() {
StackTrace = new_StackTrace();
}
);
Sys.Application.notifyScriptLoaded();
Looking at the code, its basic job is to walk the caller pointer attached to the implicit arguments variable available in every function and derive a stack trace. Pretty straigh-forward.
So you might be thinking, if somebody else wrote the stack trace code, why is this guy writing a blog entry and not providing anything new except for a few minor tweaks to the stack trace code? Well, turns out that the stack trace is only 1/2 the battle. If you use this stack trace code or any other stack trace code that you might have written or come across, you’re going to run into a seriously annoying problem if your JavaScript uses the prototyping feature to construct objects. If you use the prototype feature to create your object and then attempt to pull the stack trace, all of your method names are going to be anonymous, which is really unhelpful. To illustrate this problem, we’ll use another object defined below and then execute the sayHello method from a test page.
/// <reference name=”MicrosoftAjax.js” />Type.registerNamespace(“Animal”);Animal.Dog = function() {this._speech = “Arf!”;};
Animal.Dog.prototype = {
_speak: function() {
var trace = StackTrace.createStackTrace(arguments.callee);
alert (trace);
},
sayHello: function() {
this._speak();
}
};
Sys.Application.notifyScriptLoaded();
In this object we expose a public method, sayHello off of our Animal.Dog object. Nothing important at here except that in our _speak method we make a call to our StackTrace class and execute the createStackTrace method.
Finally, we create a small test page that executes the sayHello method when it loads. The important section is listed below.
Executing the following code gives us the following output.<asp:ScriptManagerID=”SM1″runat=”server”>
<Scripts>
<asp:ScriptReferencePath=”~/StackTrace.js” />
<asp:ScriptReferencePath=”~/StackTraceTester.js” />
</Scripts>
</asp:ScriptManager>
<script type=”text/javascript”>
functiontester () {
var test = newAnimal.Dog();
test.sayHello();
}
Sys.Application.add_init(tester);
</script>
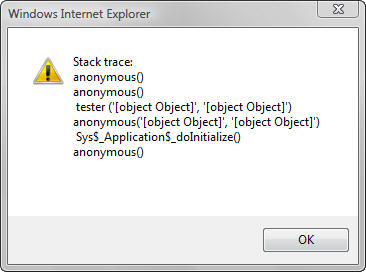
Reading the stack trace from top to bottom states that we executed an anonymous method, followed by another anonymous method, followed by our tester method, and so on. What’s striking about this stack trace is how useless it is! The anonymous method name does not help us at all for figuring out where our stack trace originated from. Can you imagine how much of a pain this would be if our stack was deeper and we had a large library of code?
Anyways, we can fix this problem, and it requires us using a technique seen in the MicrosoftAjax.debug.js file; the main ASP.NET AJAX file. In that file, Microsoft provides what can best be described as debug method names for its methods so that “anonymous” doesn’t appear in the call stack. For this example, we’ll update our Animal.Dog classes well as our StackTrace class using this method. Below is the code from the updated Animal.Dog class and the StackTrace class is updated similarly.
/// <reference name=”MicrosoftAjax.js />Type.registerNamespace(“Animal”);
Animal.Dog = functionAnimal$Dog() {
this._speech = “Arf!”;
};
Animal.Dog.prototype = {
_speak: functionAnimal$Dog$_speak() {
var trace = StackTrace.createStackTrace(arguments.callee);
alert (trace);
},
sayHello: functionAnimal$Dog$sayHello() {
this._speak();
}
};
Sys.Application.notifyScriptLoaded();
We’ve made changes to both the constructor and the methods. In the constructor we named our constructor function Animal$Dog. We named it using the dollar sign instead of the period (.) because in JavaScript a period is not valid in a function name. For the functions, we named them using the object type followed by the name of the function.
Now when we execute our test page we get the following output.
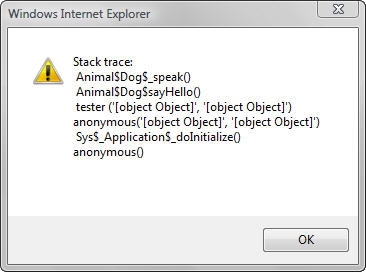
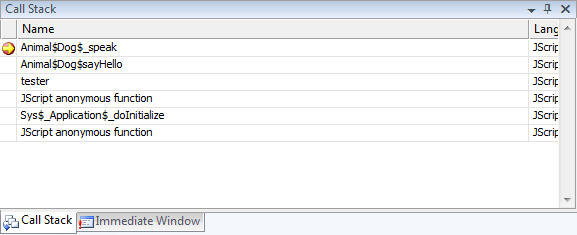
As you can see, our anonymous methods that were present in the first stack trace have turned into named methods. This is quite useful for tracing our execution. Not only does this provide us with a way to build a stack using our StackTrace object, but it gives us the method names in the Call Stack window in Visual Studio.
If you have better solution, just tell me
0 comments:
Post a Comment